
Plotting
Molecule Plot
from omigami.plotting import MoleculePlotter
from omigami.spectra_matching import Spec2Vec

client = Spec2Vec()
mgf_file_path = "path_to_file.mgf"
best_matches = client.match_spectra(mgf_file_path, n_best=10)

plotter = MoleculePlotter()
plots, legends = plotter.plot_molecule_structure(
    spectra_matches=best_matches[1],
    representation="smiles",
    draw_indices=True,
    img_size=(600, 600),
    substructure_highlight="C(=O)"
)
first_match = list(plots.values())[0]
first_match
print(legends[0])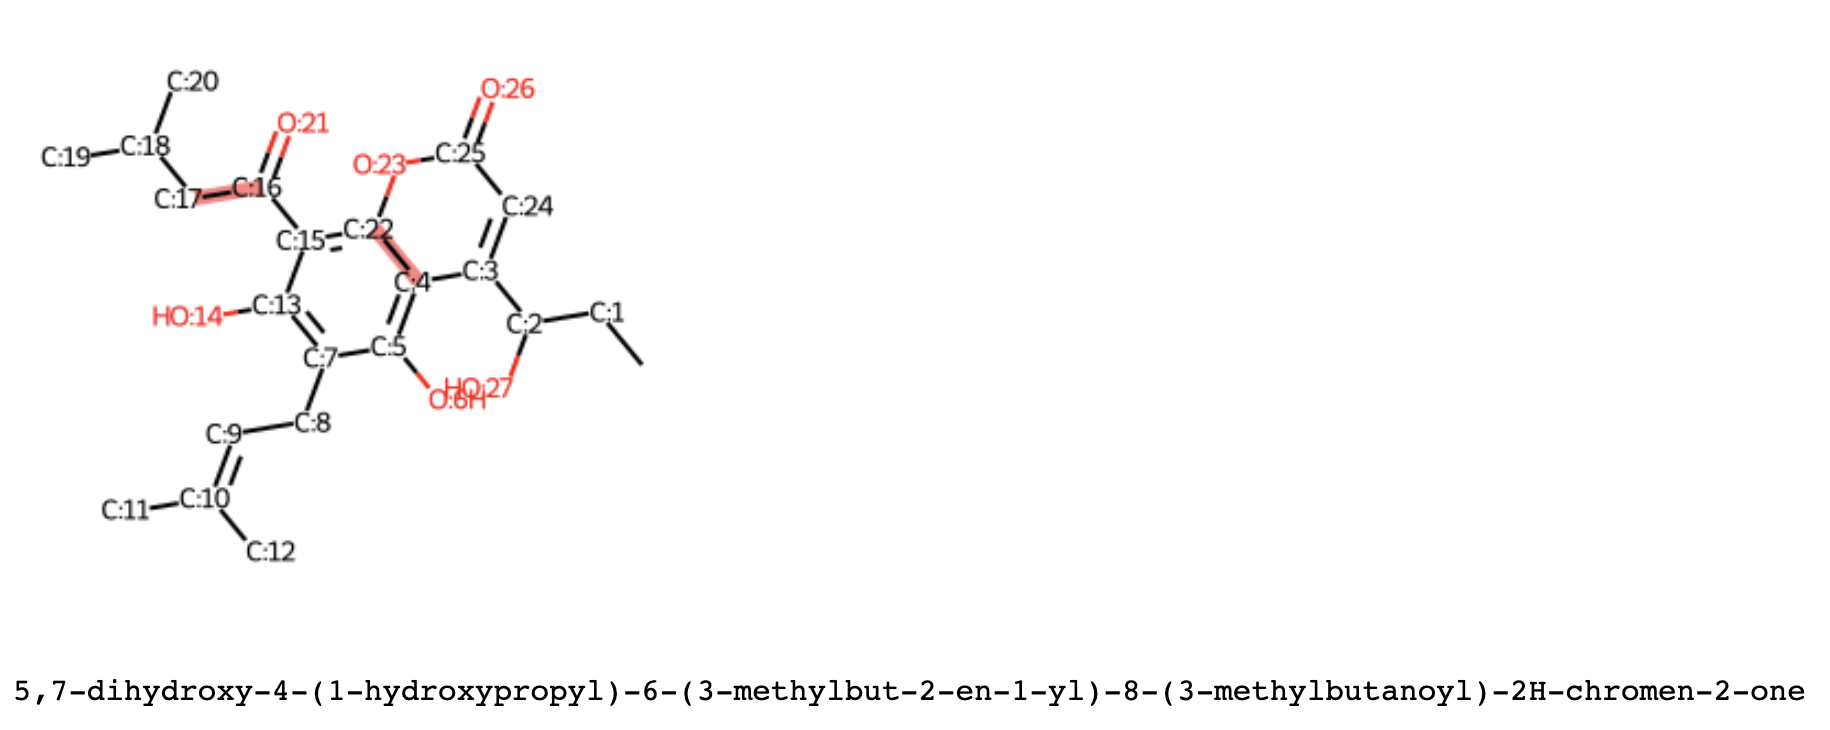
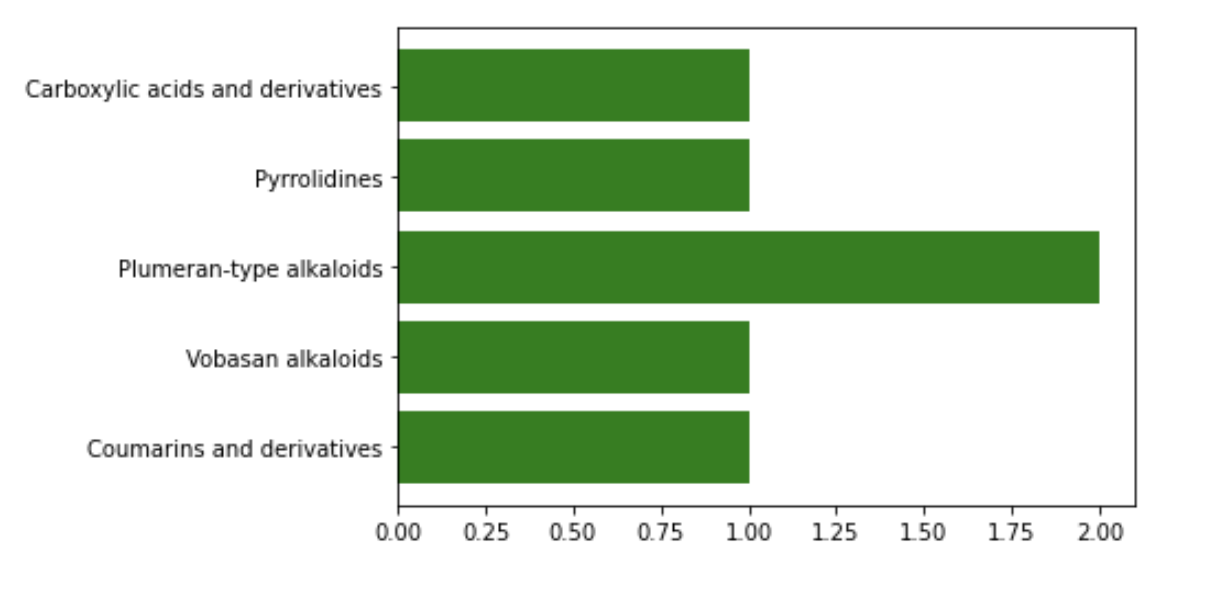
ClassyFire Plot
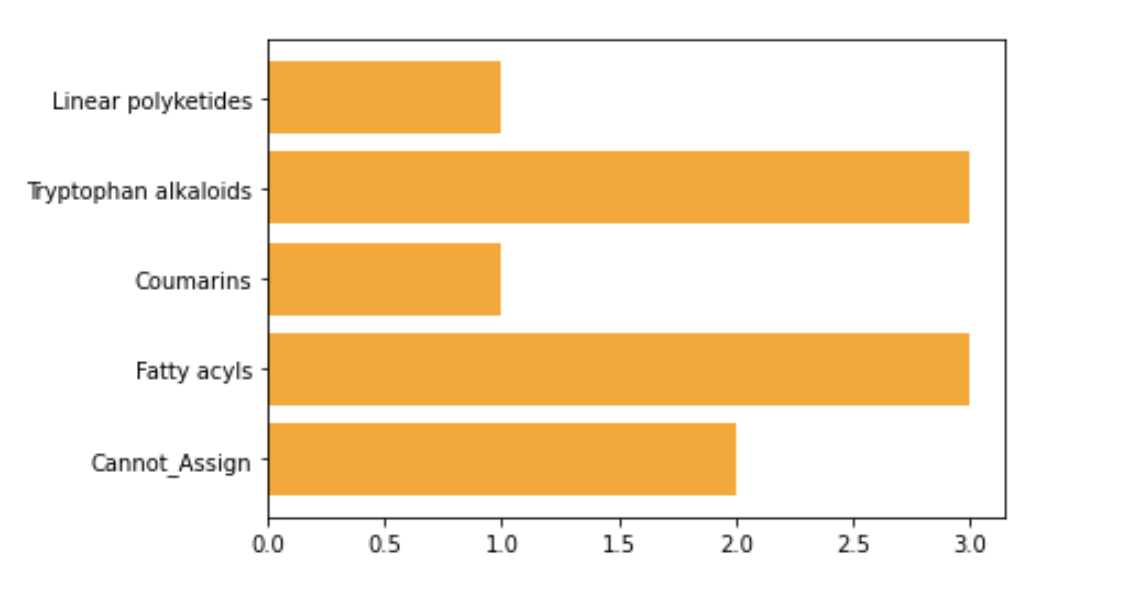
NPClassifier Plot
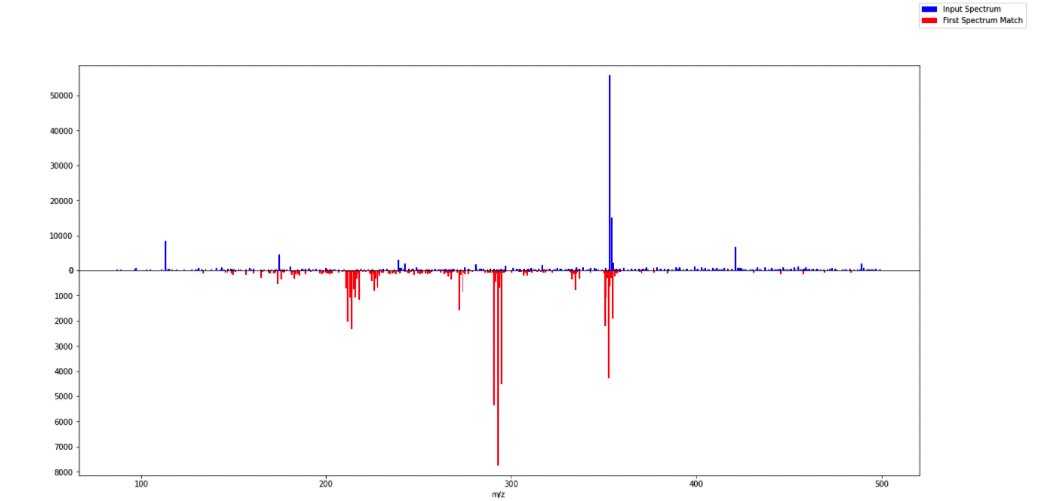
Spectra Comparison Mirror Plot
Last updated
Was this helpful?